Session 1.1.4 – Linear Regression
The Problem: Emergency Department Crowding
Emergency departments face a constant challenge: how do we know when we're too busy?
This isn't just about comfort—overcrowding in the ED is associated with:
- Increased wait times
- Delayed care for critical patients
- Higher rates of medical errors
- Poor patient satisfaction
- Provider burnout
But "too busy" is subjective. One provider might think 30 patients is overwhelming, while another might handle 50 comfortably. We need an objective, data-driven measure that can:
- Alert staff when crowding reaches concerning levels
- Guide operational decisions (like diverting ambulances)
- Help predict when resources will be strained
- Enable fair comparisons across different EDs
NEDOCS: A Real-World Implementation
The National Emergency Department Overcrowding Scale (NEDOCS) is a linear regression model used to quantify ED crowding. Here's what it looks like in practice at UVA:
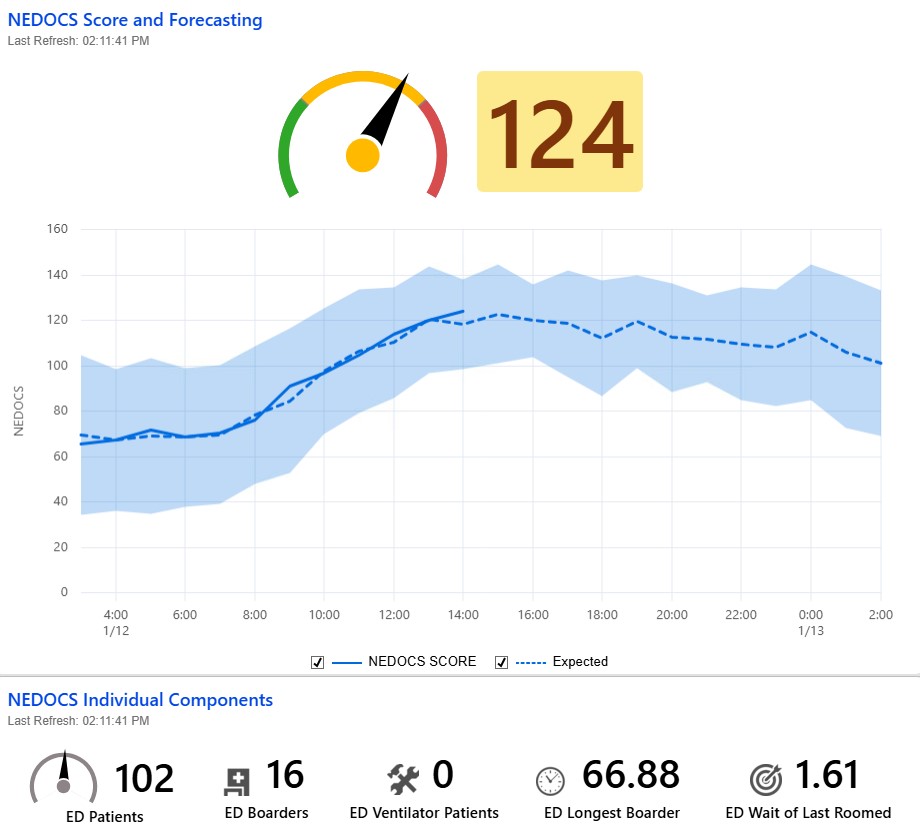
This dashboard shows the NEDOCS score in real-time, calculated from operational data in the ED. The score helps clinical and administrative staff make informed decisions about resource allocation and patient flow.
Learning Objectives
By the end of this session, you will be able to:
-
Explain the fundamental concept of linear regression - Describe how linear regression models the relationship between predictor variables and a continuous outcome, using NEDOCS as an example of predicting ED crowding scores
-
Understand multivariable regression - Explain how multivariable regression incorporates multiple predictor variables simultaneously, allowing us to account for the combined effects of several factors (like patient volume, wait times, and resource utilization) when predicting outcomes like NEDOCS scores
-
Interpret regression coefficients in clinical context - Explain what coefficients in the NEDOCS formula mean and how they quantify the contribution of each variable (e.g., number of patients, wait times) to the overall crowding score
-
Recognize the advantages and limitations of linear regression - Identify strengths (interpretability, prediction, quantifying relationships) and limitations (assumes linearity, sensitive to outliers, may oversimplify complex clinical scenarios) when applied to healthcare data
1. The Fundamental Concept of Linear Regression
What is Linear Regression?
Linear regression is a statistical method that models the relationship between one or more predictor variables (also called independent variables or features) and a continuous outcome variable (also called the dependent variable or target).
Think of it as finding the "best fit" line (or plane in multiple dimensions) through your data points.
Interactive Line Fitting
Let's explore how linear regression works by fitting a line to data points. Try adjusting the slope and intercept to make the line pass through both points:
Line Fitting Challenge
Adjust the slope and intercept to make the line pass through both points!
Equation: y = 0.00 + 0.00x
The Basic Formula
For a simple case with one predictor:
y = β₀ + β₁x + ε
Where:
- y = the outcome we're trying to predict (e.g., blood pressure)
- x = the predictor variable (e.g., pressor dose)
- β₀ = the intercept (the value of y when x = 0)
- β₁ = the slope (how much y changes for each unit increase in x)
- ε = error term (what the model doesn't explain)
Why "Linear"?
The relationship is linear because:
- If you double the number of patients, the score increases by a predictable amount
- The effect of each variable is additive—you can add up the contributions
- There are no complex interactions (though real models can include these)
How Do We Find the "Best" Line? The Method of Least Squares
So far, we've talked about what linear regression does—it finds a line that fits the data. But what do we do when the data cannot be connected with a straight line?
The answer comes from Ronald A. Fisher (1890-1962), one of the most influential statisticians of the 20th century. Fisher published his foundational paper on linear regression in 1922, and his approach remains the basis for the methods we use today. Fisher's method utilized the sum of squares technique developed by Carl Gauss, adapting it to solve the linear regression problem.
Sum of Squares
2. Multivariable Regression: Combining Multiple Predictors
From Simple to Multiple Predictors
So far, we've seen linear regression with one predictor variable (simple linear regression). But in real clinical scenarios, outcomes are rarely influenced by just one factor. Multivariable regression (also called multiple regression) allows us to include multiple predictor variables in a single model.
Why Use Multiple Variables?
Multivariable regression lets us:
- Account for multiple factors simultaneously - See how each variable contributes while controlling for others
- Improve prediction accuracy - More information leads to better predictions
- Understand complex relationships - Identify which factors matter most
The Multivariable Regression Formula
While simple regression has: y = β₀ + β₁x + ε
Multivariable regression extends this to:
y = β₀ + β₁x₁ + β₂x₂ + β₃x₃ + ... + βₙxₙ + ε
Where:
- y = the outcome (e.g., NEDOCS score)
- x₁, x₂, x₃, ... = different predictor variables
- β₁, β₂, β₃, ... = coefficients for each predictor
- β₀ = intercept (baseline value when all predictors = 0)
- ε = error term
NEDOCS: A Multivariable Regression Model
NEDOCS is a perfect example of multivariable regression. It combines five different predictor variables:
- Total ED Patients / ED Beds (occupancy rate)
- Admits / Hospital Beds (hospital capacity impact)
- Wait Time to Bed (throughput efficiency)
- Longest Admit Wait (extreme boarding situations)
- Ventilator Patients (resource intensity)
3. Interpreting Regression Coefficients in Clinical Context
What Are Coefficients?
Coefficients (the β values) tell us how much the outcome changes when a predictor changes by one unit, holding all other variables constant.
NEDOCS Formula Breakdown
The NEDOCS formula:
NEDOCS = 85.8 × (Total ED Patients / ED Beds) + 600 × (Admits / Hospital Beds) + 5.64 × (Wait Time to Bed) + 0.93 × (Longest Admit Wait) + 13.4 × (Ventilator Patients)
Interaction Terms
The NEDOCS formula shown here uses additive terms—each variable contributes independently to the score. In some cases, we might want to model interactions, where the effect of one variable depends on the value of another. For example, we could add an interaction term like (Total Patients / ED Beds) × (Admits / Hospital Beds) to capture the combined effect when both occupancy and hospital capacity are high. Interaction terms allow us to model more complex relationships where variables work together rather than simply adding their individual effects.
Interpreting Coefficients
Let's break down what each coefficient means:
Coefficient: 5.64 for (Wait Time to Bed)
- Meaning: Each hour of wait time to bed adds 5.64 points
- Clinical interpretation: Time to bed reflects throughput efficiency
- Example: A 3-hour wait contributes 16.9 points
Coefficient: 85.8 for (Total ED Patients / ED Beds)
- Meaning: For every unit increase in the ratio of patients to beds, the NEDOCS score increases by 85.8 points
- Clinical interpretation: Bed occupancy is a strong predictor of crowding
- Example: If occupancy ratio is 1.5 (150%), this contributes 128.7 points to the NEDOCS score
Interactive Demonstration
Let's explore how linear regression works with NEDOCS using an interactive tool:
NEDOCS Score Calculator
National Emergency Department Overcrowding Scale - Linear Regression Model
Emergency Department Parameters
NEDOCS Score
195
Severely Overcrowded
NEDOCS vs Total Patients
Red dot shows current configuration
Complete Linear Regression Equation:
NEDOCS = 85.8×(TP/EDB) + 600×(A/HB) + 5.64×(WTB) + 0.93×(LAW) + 13.4×(VP)
TP=Total ED Patients, EDB=ED Beds, A=Admits, HB=Hospital Beds, WTB=Wait Time to Bed, LAW=Longest Admit Wait, VP=Ventilator Patients
Current Calculation:
= 128.7 + 24.0 + 11.3 + 3.7 + 26.8
= 195
Key Concepts:
- •Linear Relationship: NEDOCS increases linearly as ED parameters worsen
- •Weighted Components: Each variable has a different coefficient (weight)
- •Predictive Value: The model helps predict crowding levels for staffing decisions
- •Clinical Utility: Scores guide interventions like diversion protocols
4. Advantages and Limitations of Linear Regression
Assumptions of Linear Regression
Linear regression makes several key assumptions about the data and the relationship between variables:
- Linearity: The relationship between predictor variables and the outcome is linear
- Independence: Observations are independent of each other (no correlation between data points)
- Homoscedasticity: The variance of errors is constant across all levels of predictor variables (no heteroscedasticity)
- Normality of errors: The residuals (errors) are normally distributed
- No multicollinearity: Predictor variables are not highly correlated with each other (in multivariable regression)
- No outliers: Extreme values that don't fit the pattern don't unduly influence the model
Note: These assumptions don't always need to be perfectly met. Linear regression is often robust to minor violations, but understanding these assumptions helps you know when to use linear regression and when to consider alternatives.
When Linear Regression Works Well
✅ Good for:
- Continuous outcomes (scores, measurements, counts)
- When relationships are approximately linear
- When interpretability is important
- When you have a relatively small dataset
- When you need fast predictions
When to Consider Alternatives
❌ Consider other methods when:
- Relationships are clearly non-linear
- You have many interacting variables
- You need to predict probabilities (use logistic regression)
- You have very complex patterns (consider machine learning)
- You have limited data (consider simpler models)
5. Assessing Goodness of Fit: How Well Does the Model Work?
Even if a regression model is statistically valid, we still need to ask: how well does it describe the data, and is it the right level of complexity for the problem? Measures of goodness of fit help us answer these questions.
R²: Proportion of Variation Explained
R² (R-squared) tells us what proportion of the variability in the outcome (e.g., NEDOCS score) is explained by the predictors in the model.
- Range: 0 to 1 (or 0% to 100%)
- Interpretation: Higher R² means the model explains more of the variation in the outcome
- Example: R² = 0.70 means 70% of the variation in NEDOCS scores is explained by the predictors in the model
However:
- R² always increases (or stays the same) when you add more predictors, even if they are not clinically meaningful
- A very high R² does not guarantee that the model will generalize well to new patients or time periods
Adjusted R²: Penalizing Unnecessary Complexity
Adjusted R² modifies R² to penalize adding predictors that do not meaningfully improve the model.
- It will increase only if a new variable improves the model more than would be expected by chance
- It can decrease when you add weak or irrelevant predictors
- This makes adjusted R² more useful than raw R² when comparing models with different numbers of predictors
AIC and BIC: Balancing Fit and Simplicity
Two widely used metrics for comparing models are:
- Akaike Information Criterion (AIC)
- Bayesian Information Criterion (BIC)
Both:
- Are based on how well the model fits the data and how many parameters it uses
- Penalize more complex models (with more predictors or parameters)
- Are used to compare models: lower AIC or BIC values indicate a better balance of fit and simplicity
Key differences:
- AIC: Typically more tolerant of complexity; often used when the goal is prediction
- BIC: Harsher penalty for extra parameters; often used when the goal is finding the “best” explanatory model given the data
Clinical Perspective: Choosing a "Good Enough" Model
When evaluating regression models in healthcare (like NEDOCS or a mortality prediction model), we should ask:
- Does the model explain enough variation (R² / adjusted R²) to be useful for decisions?
- Is the model too complex for the setting (AIC/BIC, number of variables, ease of implementation)?
- Are the predictors clinically meaningful and available in real time?
In practice, a slightly less predictive but simpler model may be preferred if it is easier to implement, understand, and maintain in a busy clinical environment.
Summary
Key Takeaways
-
Linear regression models relationships between predictor variables and continuous outcomes using a linear equation, finding the "best fit" line through data points using the method of least squares (sum of squares)
-
Multivariable regression extends linear regression to include multiple predictor variables simultaneously, allowing us to account for the combined effects of several factors (like patient volume, wait times, and resource utilization) when predicting outcomes
-
Coefficients quantify contributions—each coefficient tells you how much that variable affects the outcome while holding all other variables constant, which helps prioritize interventions and understand which factors matter most
-
Linear regression has strengths (interpretability, prediction, quantifying relationships) and limitations (assumes linearity, sensitive to outliers, may oversimplify complex scenarios)—know when it's appropriate and when to consider alternatives
Questions for Reflection
- Can you think of other clinical scenarios where linear regression might be useful?
- What are some potential limitations of using NEDOCS to make operational decisions?
- How might the coefficients in NEDOCS change if you were modeling a different type of ED (pediatric vs. adult, trauma center vs. community hospital)?
- What additional variables might improve the NEDOCS model?
References
-
Fisher, R. A. (1922). The goodness of fit of regression formulæ, and the distribution of regression coefficients. Journal of the Royal Statistical Society, 85(4), 597-612
-
Weiss et al. (2004). "Development and validation of a new index to measure emergency department crowding." Academic Emergency Medicine, 11(1), 38-42.